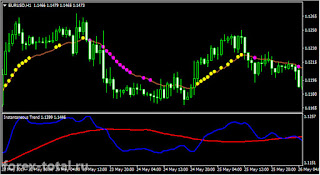
This trend trading strategy is based on two instant indicators Trend Instant and Var Mov Avg, which determine the direction of the trend, while complementing and confirming each other's signals.
Characteristics of the trend trading strategy on the indicators Instantaneous Trend and Var Mov Avg .
- Platform: MetaTrader 4 .
- Currency pairs: any.
- Timeframe: H1, H4.
- Hours: around the clock.
- Broker: Forex4you , InstaForex , RoboForex , Fort Financial Services .
Indicators Used:
- Custom indicator Instantaneous Trend (default settings).
- Custom Var Mov Avg indicator (default settings).
The Instantaneous Trend custom indicator was created by John Elers to identify a trend in the market, eliminating its cyclical nature (which is typical for oscillators ).
The Var Mov Avg custom indicator is based on the moving average , but gives more accurate signals based on the noise filter. It shows changes in color when a trend changes.
You may need to adjust the display of indicators by color and line width of indicators for better visualization of indicator signals. It is individual for each.
Trend trading strategy on the indicators Instantaneous Trend and Var Mov Avg . Rules of work.
Entry conditions for a long position:
1. If the blue line of the Instantaneous Trend indicator crosses the red line from bottom to top and is above it, then this is a buy signal (bullish trend). Also note that the larger the gap between the blue and red lines, the stronger the trend.
2. If yellow dots begin to form on the Var Mov Avg indicator and the candle closes above the indicator line, this is a signal to open a buy position.
When the signals of both indicators appear, open a position.
Stop loss and take profit.
Place a stop loss a few points below the nearest low.
Take profit can be set in several ways.
1. Close the position when the blue line of the Instantaneous Trend indicator crosses the red line in the opposite direction.
2. Close the position when the magenta dot of the Var Mov Avg indicator appears.
3. We close the position when the price crosses the line of the Var Mov Avg indicator in the opposite direction.
Test these three options and look for a more suitable one specifically for your trading style .
Entry conditions for a short position:
1. If the blue line of the Instantaneous Trend indicator crosses the red line from top to bottom and is below it, then this is a sell signal (bearish trend). Here, too, the rule is that the larger the gap between the blue and red lines, the stronger the trend.
2. If purple dots begin to form on the Var Mov Avg indicator and the candle closes below the indicator line, this is a signal to open a sell position.
When the signals of both indicators appear, open a position.
Stop loss and take profit.
Place a stop loss a few points above the nearest maximum.
Take profit can also be set in several ways.
1. Close the position when the blue line of the Instantaneous Trend indicator crosses the red line in the opposite direction.
2. Close the position when the yellow dot of the Var Mov Avg indicator appears.
3. We close the position when the price crosses the line of the Var Mov Avg indicator in the opposite direction.
Trend trading strategy on the indicators Instantaneous Trend and Var Mov Avg . An example of work.
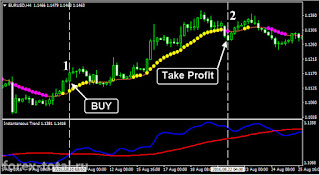
Consider the operation of this trading strategy as an example. Currency pair EUR / USD timeframe Н4.
At point 1, both conditions for opening a buy position are fulfilled. We open a Buy deal at a price of 1.1145. Stop loss is 80 points (1.1065). We close the deal when the first purple point appears, at the level of 1.1287. Take profit is 142 points.


إرسال تعليق