


Trading strategy on the indicators EMA, RSI and MACD. The strategy is a trend, therefore, shows good results on large trend movements. It uses standard indicators EMA, RSI and MACD.
Characteristics of the trading strategy on the indicators EMA, RSI and MACD .
- Platform: MetaTrader 4 .
- Currency pairs: any, preferably highly volatile.
- Timeframe: any.
- Operating time: depending on the selected timeframe.
- Broker: Forex4you , InstaForex , RoboForex , Fort Financial Services .
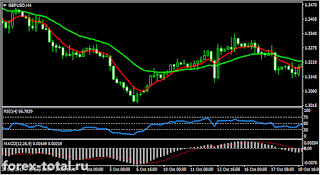
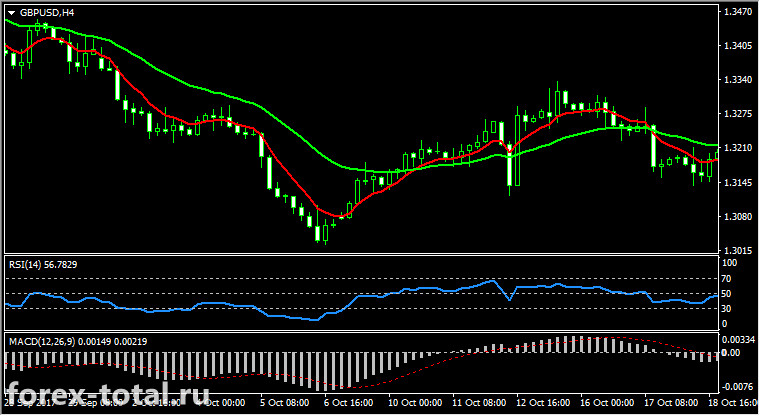
Used indicators and their parameters:
RSI Signals
Relative Strength Index ( RSI ) is an oscillator and a leading indicator. Its values range from 0 to 100. It will never rise above 100 and never fall below 0, but the most important levels are between 30 and 70.
As soon as the RSI rises above 70, we believe that the currency pair is overbought and expect prices to fall; if the RSI falls below 30, we believe that the currency pair is oversold and we expect prices to rise.
MACD and EMA Signals
This trading strategy uses two moving averages ( EMA ) with different periods. Their intersection will be a signal.
MACD must confirm the signals of the remaining indicators in order to accurately enter the position and filter out false signals.
Indicator Parameters:
Fast EMA - Period (7)
Slow EMA - Period (26)
RSI - default settings
MACD - parameters (12, 26, 9)
 Rules of work on the trading strategy on the indicators EMA, RSI and MACD.
Entry conditions for a long position:
- EMA7 crosses EMA26 from bottom to top;
- The RSI indicator crosses level 50 from the bottom up;
- MACD indicator bars begin to form above the zero level.
We place the stop loss several points below the line of the EMA26 indicator.
Take Profit . We close the position when the MACD indicator crosses the zero level from top to bottom.
Entry conditions for a short position:
- EMA7 crosses the EMA26 from top to bottom;
- The RSI indicator crosses level 50 from top to bottom;
- MACD indicator bars begin to form below the zero level.
We place the stop loss several points above the line of the EMA26 indicator.
Take Profit . We close the position at the reverse intersection of the zero level with the MACD indicator.
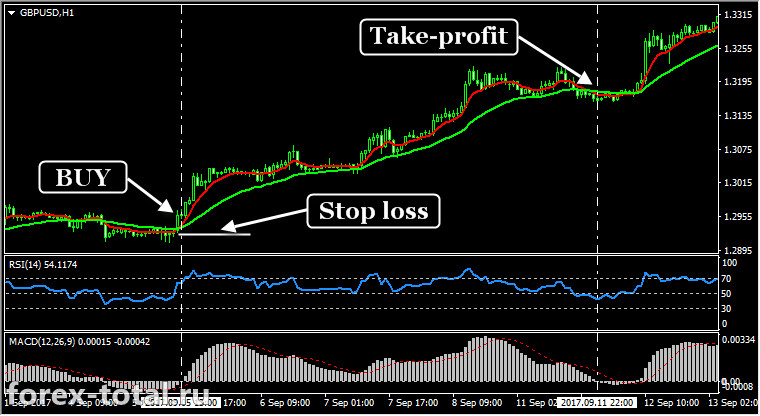
Consider the work of a trading strategy using an example
 Currency pair GBP / USD hourly chart. As you can see, all three conditions for a purchase transaction are met. We open a BUY position at the price of 1.2956. Stop loss is set at 1.2926 (30 points). When the MACD indicator crosses the zero level in the opposite direction, close the position at the price of 1.3163. Take profit amounted to 207 points.
The strategy is trending, therefore it brings good profit on trending price movements. In the lateral range, positions can often be closed by stop loss.
Characteristics of the trading strategy on the indicators EMA, RSI and MACD .
- Platform: MetaTrader 4 .
- Currency pairs: any, preferably highly volatile.
- Timeframe: any.
- Operating time: depending on the selected timeframe.
- Broker: Forex4you , InstaForex , RoboForex , Fort Financial Services .
Used indicators and their parameters:
RSI Signals
Relative Strength Index ( RSI ) is an oscillator and a leading indicator. Its values range from 0 to 100. It will never rise above 100 and never fall below 0, but the most important levels are between 30 and 70.
As soon as the RSI rises above 70, we believe that the currency pair is overbought and expect prices to fall; if the RSI falls below 30, we believe that the currency pair is oversold and we expect prices to rise.
MACD and EMA Signals
This trading strategy uses two moving averages ( EMA ) with different periods. Their intersection will be a signal.
MACD must confirm the signals of the remaining indicators in order to accurately enter the position and filter out false signals.
Indicator Parameters:
Fast EMA - Period (7)
Slow EMA - Period (26)
RSI - default settings
MACD - parameters (12, 26, 9)
Entry conditions for a long position:
- EMA7 crosses EMA26 from bottom to top;
- The RSI indicator crosses level 50 from the bottom up;
- MACD indicator bars begin to form above the zero level.
We place the stop loss several points below the line of the EMA26 indicator.
Take Profit . We close the position when the MACD indicator crosses the zero level from top to bottom.
Entry conditions for a short position:
- EMA7 crosses the EMA26 from top to bottom;
- The RSI indicator crosses level 50 from top to bottom;
- MACD indicator bars begin to form below the zero level.
We place the stop loss several points above the line of the EMA26 indicator.
Take Profit . We close the position at the reverse intersection of the zero level with the MACD indicator.
Consider the work of a trading strategy using an example
The strategy is trending, therefore it brings good profit on trending price movements. In the lateral range, positions can often be closed by stop loss.
إرسال تعليق