Forex Trading Strategy FX Profit Wave contains three custom indicators TSI, ML and Histodot. The strategy is a trend, it is easy to understand and implement. So any beginner will cope with it.
Characteristics of Forex FX Profit Wave Trading Strategy
- Platform: MetaTrader 4 .
- Currency pairs: any.
- Timeframe: H1 and above.
- Hours: around the clock.
- Broker: Forex4you , InstaForex , RoboForex , Fort Financial Services
Used indicators and their parameters:
1. Custom TSI indicator (Trend Strenght Indicator) or trend strength indicator. From the name it’s clear that it shows the strength of the trend. It is a window in the main chart in the upper right corner. Blue color shows the power of bulls, red - the power of bears. The larger the number, the stronger the trend.
The TSI indicator shows the direction in which we are trading.
2. The custom indicator ML is plotted on the current price chart and is displayed as a blue line under the candles in an uptrend or a red line above the candles in a downtrend.
This indicator is a trend indicator that makes it possible to determine and predict the trend movement. If the ML indicator gives a blue line under the candles, then we open only buy positions, if the red line above the candles we open only sell positions.
3. The custom Histodot indicator consists of two parts: histograms and dots. To get a valid buy or sell signal, histograms and points must be consistent.
For transactions to buy, the histograms should be blue and above the zero line, and the points should be green. For sales transactions, the histograms should be orange and below the zero line, and the points should be white.
Rules for working on the Forex trading strategy FX Profit Wave .
Entry conditions for a long position:
The TSI should be bullish, i.e. blue should be greater than 50.
The ML indicator should be blue and below the candles.
Histodot indicator histograms should be blue and above the zero line.
Histodot indicator points should be green.
After all the conditions are met, open a buy position.
Stop loss is set a few points below the previous minimum.
Take profit set 2 times more than stop loss.
Entry conditions for a short position:
The TSI indicator should give a bearish signal, i.e. red should be greater than 50.
The ML indicator should be red and above the candles.
Histodot indicator histograms should be orange and below the zero line.
Histodot indicator points should be white.
After all the conditions are met, open a position for sale.
Stop loss is set a few points above the previous maximum.
Take profit set 2 times more than stop loss.
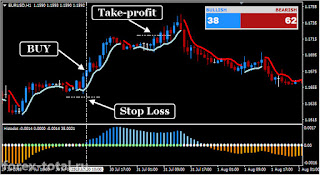
An example of work on the Forex trading strategy FX Profit Wave .
Currency pair EUR / USD hourly chart.
In the image we see that all the conditions for the purchase are met. We open a buy position at the price of 1.1669. Stop loss is just below the nearest low (24 points). Take profit set 48 points. Soon our position closes at take profit.


إرسال تعليق